

Markets are messy right now. A high-profile political admission, a few shaky stock charts, and cryptocurrencies sitting at readings that scream “oversold” have created the perfect stew of fear, hope, and confusion. Bitcoin looks undervalued by several traditional measures, Ethereum is flirting with technical support that has historically marked bottoms, and speculative tokens are compressed and ready to move. Meanwhile, headlines about a supposed political regret have been wildly misinterpreted — and that confusion matters for positioning.
Table of Contents
- What Trump Actually Said (and why context matters)
- Macro angle: Warsh, Bessent, and the idea of coordinated policy
- Bitcoin: levels, signals, and why this might be the last major oversold call
- Bitcoin vs gold and the “digital gold” narrative
- Ethereum: hitting historical support, but the path isn’t guaranteed
- Solana and the compressed volatility trap
- Meme coins, speculative plays, and the risk of sector contagion
- What’s happening in stocks: Russell, Meta, AMD, and energy names
- Practical trading framework for this environment
- Key data points to watch this week
- Final thoughts — being opportunistic without getting reckless
What Trump Actually Said (and why context matters)
Social media loves a dramatic, simplified headline. When a well-known political figure says, “I made a mistake,” the internet explodes. That’s exactly what happened when a comment about a Fed pick was shared out of context. It’s important to be precise here: the admission was about a prior decision, not the more recent Fed nomination that markets are celebrating.
“I made a mistake. He was runner-up, if you want to say that. He was a finalist… I had somebody that was my secretary of the Treasury. He wanted him so badly… it was a mistake. It was really a big mistake.”
Whether or not you care about the politics, the key takeaway is how markets parse leadership, policy, and coordination between Treasury and the Fed. Rumors of a tighter partnership — a Treasury and Fed that actually coordinate rather than clash — can change risk appetite. That’s why we’re hearing chatter about potential 15% economic growth under the right leadership, and why some traders see the nomination and alignment as a bullish macro signal.
Macro angle: Warsh, Bessent, and the idea of coordinated policy
The rumor mill isn’t just idle gossip. Names like Kevin Warsh and Scott Bessent have surfaced in market conversations as potential figures who could bring a different tone to monetary policy and fiscal coordination. A Treasury-Fed “alliance” would reduce policy friction, and some market participants believe that could quickly morph into hotter risk-on flows.
Be skeptical and pragmatic. A claim about 15% GDP growth is eye-catching but unrealistic as an immediate forecast. Instead, view these comments as directional: if market participants believe policy will be friendlier to growth, equity multiples expand, credit conditions ease, and liquidity-seeking flows increase — which historically helps both stocks and crypto.
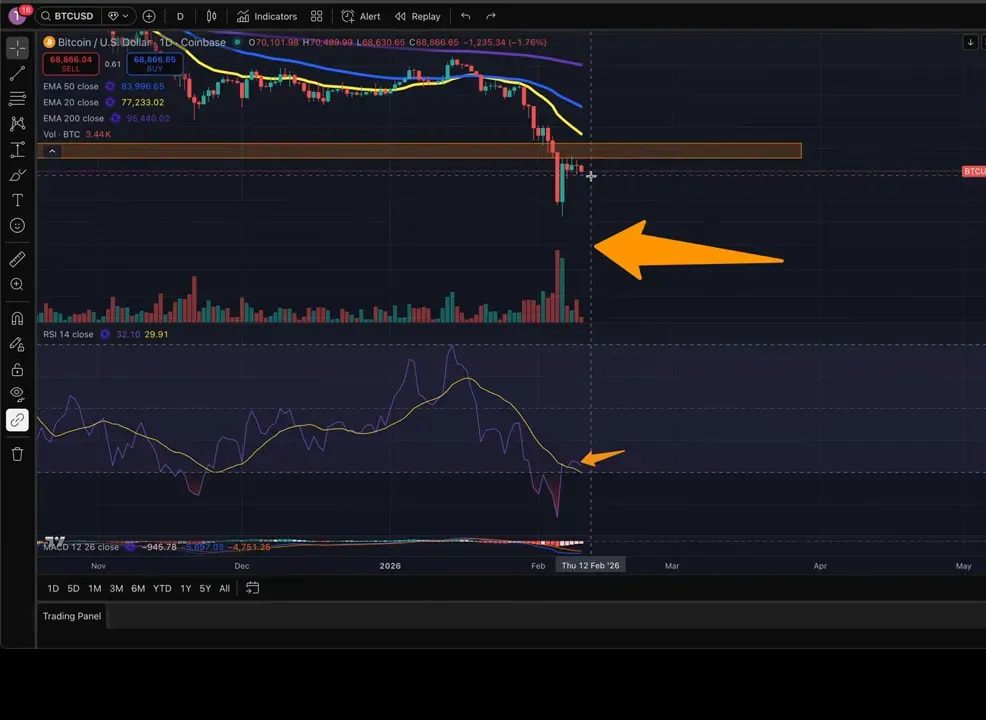
Bitcoin: levels, signals, and why this might be the last major oversold call
Bitcoin is trading in a narrow band right now — roughly $68k on the low end to $72k on the top end. This orange box is the battleground. A clean break in either direction is likely to produce a more exaggerated move.
Key technical points to remember:
- Immediate range: $68k–$72k is the short-term zone of interest.
- CME gap: If buyers break above $72k decisively, the path could be clear toward filling a gap around $83k.
- Bear market confirmation: Bitcoin remains under short- and mid-term moving averages (20, 50, 200-day), and the market has been “in a bear market” since losing the 50-week moving average.
- Weekly 200-week EMA: This is the charging bull/bear line in crypto. Weekly closes above it are constructive; closes below raise the probability of deeper downside (50k-range scenarios are on the table if that happens).
- RSI oversold reading: Weekly RSI is at readings typically seen only at deep bear-market bottoms. These readings don’t guarantee immediate rallies, but they do increase the probability of mean reversion rallies.
Volumes have cooled since the big move, and ETF flows matter. Two positive days of ETF inflows (for example, a $150M day) help, but the market needs sustained, larger inflows to summon a durable rally. Meanwhile, panic selling by weak hands can continue to create supply even as technical conditions look attractive.
If you trade spot Bitcoin, this is exactly the type of environment where timely signals can help you avoid common traps — catching short-term mean reversion bounces without being left holding the bag in a deeper washout. Consider pairing technical observations above with disciplined risk management and, if it fits your process, a reliable set of crypto spot trading signals to highlight high-probability entries and exits during noisy, high-volatility weeks.
Bitcoin vs gold and the “digital gold” narrative
One fascinating cross-asset observation: Bitcoin has rarely, if ever, been this undervalued against gold on certain normalized measures. For long-term believers, this chart is compelling. If macro flows tilt toward inflation or loose policy expectations, the narrative of Bitcoin as digital gold re-enters the conversation strongly.
That said, correlations shift. There’s a surprising visual similarity between Bitcoin and traditional software ETFs at times — a reminder that Wall Street sometimes treats crypto like another high-beta tech play rather than a distinct monetary asset. If that perception changes, performance divergence could emerge quickly.
Ethereum: hitting historical support, but the path isn’t guaranteed
Ethereum’s two-week chart has dropped to the bottom end of the Bollinger Bands — a zone that has historically acted as a bottoming area during previous sell-offs and even during the 2022 low. That does not mean Ethereum cannot plunge further; anything is possible in markets. But statistically and technically, this is a legitimate area to hunt for a bottoming pattern.
Important Ethereum indicators:
- Bollinger band support: Many prior major declines paused and reversed when touching this band.
- MACD: The daily MACD is moving toward a potential bullish crossover. A confirmed crossover would increase the odds of a meaningful rally, though past examples show rallies can be followed by renewed declines if the broader market sells off later.
- Correlation with Nasdaq: A strong positive link remains between ETH and growth stocks. A severe hit to equities would likely depress ETH, so stock-health is important context.
Trading altcoins and Ethereum in this environment requires discipline. Short, strategic positions around technical support with tight risk controls can make sense for volatility-seeking traders. Again, this is where crypto spot trading signals provide value: they can highlight higher-probability setups and reduce emotional, poorly timed entries during frantic pullbacks.
Solana and the compressed volatility trap
Solana has been trading flat for days — volatility compression that tends to precede a sizable breakout or breakdown. The bears love to predict a “fat dump” when price gets sleepy like this, and that is a real risk. But compressed ranges are simply a warning: the next move will likely be larger than recent ones.
Tactical levels for Solana:
- Bear case: If price breaks and holds below roughly $80, expect a meaningful correction.
- Bull case: A breakout above $88 could open a run toward prior downtrend resistance near $130.
- Strategy: Wait for a confirmed breakout with volume, or use tight ranges for mean-reversion scalps until direction is established.
Solana’s higher beta nature means it is attractive for traders looking to accelerate returns, but that also means faster, deeper drawdowns. For traders seeking structured setups, combining clear technical triggers with crypto spot trading signals can help identify which breakouts have the best follow-through probability and which are likely false.
Meme coins, speculative plays, and the risk of sector contagion
Tokens like Pepe and other memecoins remain a wild card. They can spike violently on flows and sentiment, then collapse just as fast. These assets are not for the faint-hearted; they’re essentially pure sentiment plays. Keep exposures tiny and time horizons short.
If you play high-beta coins, use explicit position sizing rules and signals to avoid emotional overtrading. A disciplined approach to memecoins — entering only when a signal confirms momentum or identifies favorable risk-to-reward — preserves capital for better opportunities.
What’s happening in stocks: Russell, Meta, AMD, and energy names
It’s not just crypto. Stocks show a bifurcated market: the Russell 2000 is bouncing and is just a couple percent away from new all-time highs, signaling strong risk appetite in small-caps. The S&P 500 is near all-time highs as well. These are bullish signs for risk assets in general, but the internals matter.
Meta recently bounced off a cluster of EMAs (20/50/200-day), testing the top of a triangle pattern. Bulls want to see price hold above this cluster; daily closes back within the triangle would suggest a failed breakout and increase the odds of more downside.
AMD is a textbook watchlist name right now. It bounced off the 200-day EMA but still sits in a downtrend on the MACD. More worryingly, the daily chart suggests a potential double top with price now at the neckline. If the 200-day fails to hold and the neckline breaks, downside targets could extend back toward the $115–$120 area — a sizable drop from recent highs.
Energy names like Iron Energy have shown explosive moves and quick retracements. They test the 200-day EMA frequently; for iron bulls, staying above certain levels (like $36 in the example discussed) is crucial. Failure to hold invites deeper corrections.
Practical trading framework for this environment
Oversold markets look tempting, but timing and discipline matter. Here’s a simple checklist to trade smarter in the current macro and crypto environment:
- Define your time horizon: Are you a day trader, swing trader, or investor? Your tools and size should match.
- Respect the weekly close: For crypto, weekly closes above the 200-week EMA matter. Wick tests are common, but the close holds more information.
- Wait for confirmation: Breakouts with volume and follow-through are real. Fakeouts happen often in low-volume rallies.
- Use risk caps: Limit any single trade to a small percentage of your total capital — especially in meme and small-cap markets.
- Plan entries and exits: Identify clear stop levels and targets before entering. Emotional exits are where most traders lose money.
- Leverage signals thoughtfully: If you follow a service for trade ideas, use the signals as a filter, not an autopilot.
For traders who want a practical edge, combining technical observation with curated trade ideas can save time and reduce cognitive load. Our crypto spot trading signals are designed to highlight high-probability setups across Bitcoin, Ethereum, and select altcoins. Think of them as a disciplined filter that complements your own analysis.
Key data points to watch this week
A few headline indicators will likely move sentiment this week:
- Weekly close vs 200-week EMA: A decisive weekly close above supports the bullish case; a close below increases downside odds substantially.
- ETF inflows: Sustained, large ETF inflows can drive durable rallies. Small one-off inflows matter less.
- ISM PMI and macro prints: Manufacturing and service PMI breakouts add to risk-on narratives.
- Equity performance: Watch the S&P 500 and Russell 2000 — leadership or weakness there tends to spill into crypto.
- Volume confirmation: Breakouts without volume are suspect. Look for volume to validate directional moves.
Final thoughts — being opportunistic without getting reckless
This is a classic “inflection” environment: technical oversold indicators suggest higher probability of rallies, but macro uncertainty and headline noise mean traps are plentiful. The smartest traders don’t force a narrative — they adapt to what the charts and data show.
Short-term traders can find opportunity in mean reversion bounces and breakout plays. Longer-term holders should focus on major weekly closes and macro trajectories. Regardless of your time frame, a disciplined approach to entries, stops, and position sizing is the difference between surviving and thriving.
If you’re trading actively and want a structured companion to your own analysis, targeted trade ideas from a reliable service can be helpful. Our crypto spot trading signals aim to do exactly that: identify real, evidence-backed setups and keep noise to a minimum.
Is Bitcoin guaranteed to rally because it’s oversold?
No. Oversold readings increase the probability of a bounce, but they do not guarantee a sustained rally. Always watch for confirmation signals like weekly closes above key EMAs and volume on breakouts.
What happens if Bitcoin closes the week below the 200-week EMA?
A close below that level increases the odds of a deeper correction. Targets in the $50k range become more plausible, though exact outcomes depend on macro conditions and liquidity flows.
Should I trade altcoins now or wait?
If you trade altcoins, use tighter sizing and prefer setups with clear technical triggers. Volatility compression in many altcoins means breakouts can be explosive in either direction. For many, waiting for confirmation or using curated signals to filter trades reduces risk.
How important are ETF inflows for crypto price action?
Very important. Sustained, large inflows can provide durable demand and help lift prices, whereas small or inconsistent inflows may not be enough to overcome persistent selling pressure.
Can stock market weakness kill a crypto rally?
Yes. Crypto has meaningful correlation with risk assets. A major equity sell-off would likely pressure crypto markets, reducing the chance of a standalone crypto boom during those periods.
Markets are a chess game. Know your edge, respect risk, and let the charts tell the story. If you want structured, actionable trade ideas across major crypto assets and higher-beta plays, consider integrating disciplined crypto spot trading signals into your workflow — they can filter noise and point you to setups with cleaner risk-reward.
